|
|
Information Related to Pennsylvania Deep Gas Well Activity
|
|
|
|
|
|
Complete County & State Statistics are only available to Full Members
Full Members have access to the many features available at MarcellusGas.Org - Become a Full Member
Close This Box
|
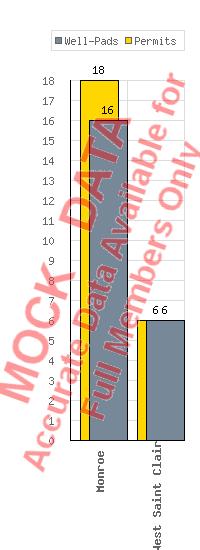
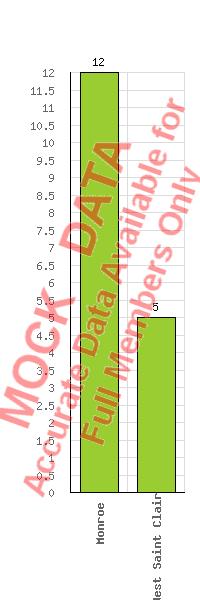
Permitted Unconventional Wells and Well-Pads by Township for Bedford County, Pennsylvania
(---): the total number of permitted wells in Bedford County to date.
(---) Township is the township with the highest number of permitted wells to date ((---)).
(---): the total number of permitted well-pads in Bedford County to date.
|
Graph: Unconventional Well Permits & Well-Pads per Township for Bedford County, Pennsylvania
|
|
Bedford County Townships in Alphabetical Order
|
Based on data up to Jul 18th, 2026
© MarcelluGas.Org - All right reserved - Contact MarcellusGas.Org for reprint information.
|
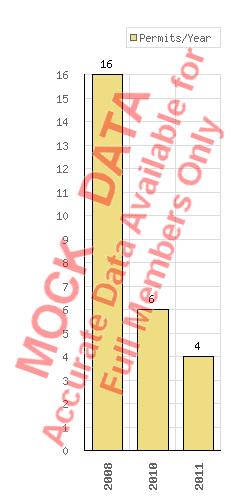
Graph: Unconventional Well Permits by Year for Bedford County, Pennsylvania
|
|
Years in chronological order - current year represents permits approved as of Jul 18th, 2026 |
Based on data up to Jul 18th, 2026
© MarcelluGas.Org - All right reserved - Contact MarcellusGas.Org for reprint information.
|
Graph: Unconventional Well Starts by Year for Bedford County, Pennsylvania
|
|
Years in chronological order - current year represents the number of wells started as of Jul 18th, 2026 |
© MarcelluGas.Org - All right reserved - Contact MarcellusGas.Org for reprint information.
|
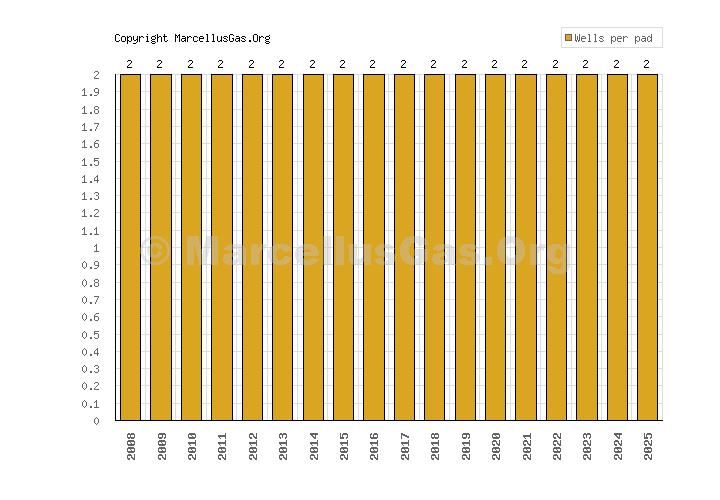
Graph: Average Number of Permitted Wells per Well Site by Year for Bedford County, Pennsylvania
|
|
Yearly tallies are cumulative - only well-pads with multiple wells are considered.
|
Based on data up to Jul 18th, 2026
© MarcelluGas.Org - All right reserved - Contact MarcellusGas.Org for reprint information.
|
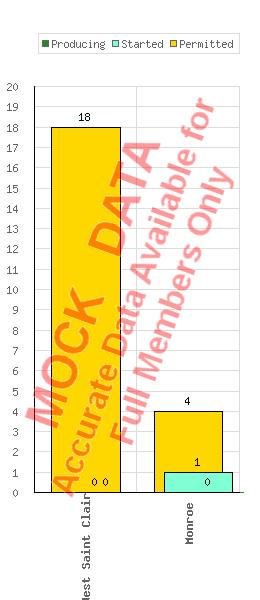
Graph: Unconventional Well Status: Producing, Started, Permitted - by Township for Bedford County, Pennsylvania
|
Bedford County Townships in Alphabetical Order
|
Permitted and Started wells based on DEP data as of Jul 18th, 2026
Producing wells based on DEP data as of May 31st, 2026 [DEP data date: 07/16/2026] (most recent available from DEP)
© MarcelluGas.Org - All right reserved - Contact MarcellusGas.Org for reprint information.
|
|
Return to top
|
There is no Production Data available for
Bedford County, PA
|
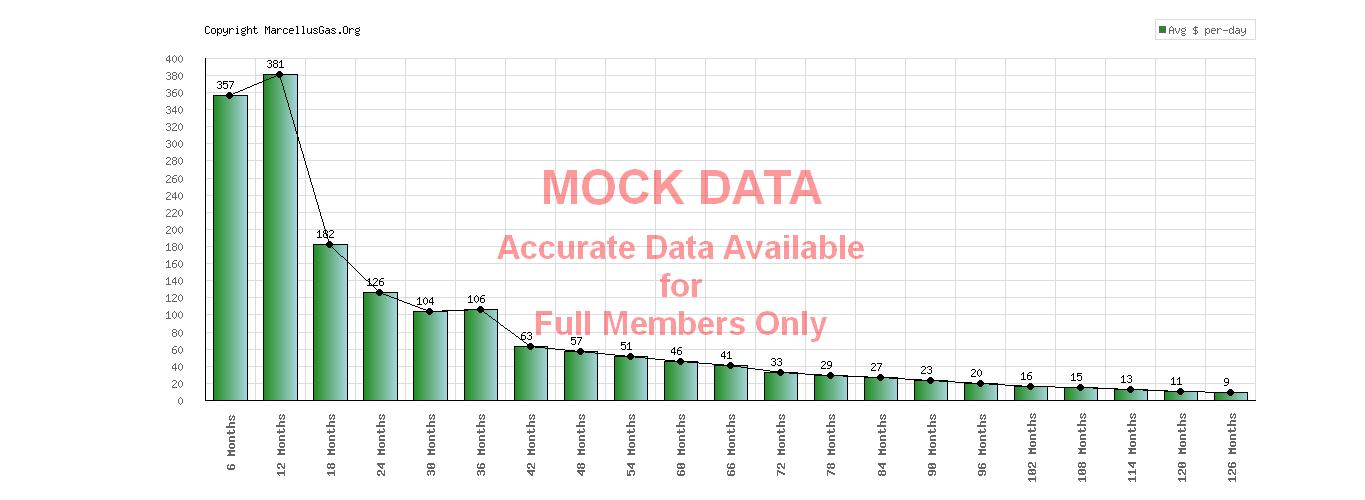
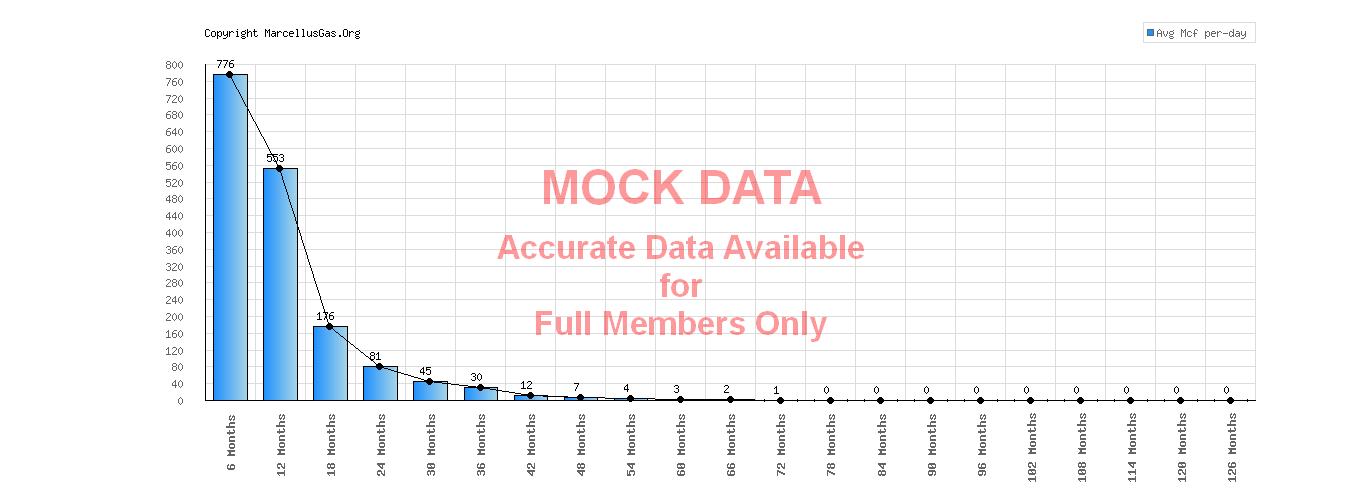
Average Per-Day Estimated Royalties/Per-Day Production in 6 Month Segments - Bedford County, Pennsylvania
NOTE: royalty estimates based on crowd sourced ATW values (view crowd sourced pricing page)
The graphs below display the average per-day production values
for wells as they progress through 6 month production reporting periods.
(---) qualifying wells were used in per-day production calculations
(---)% - percentage drop in production over reporting period
|
Show/Hide Statistical Criteria
|
Average Per-Day Values in 6 Month Segments - Bedford County
|
Based on most recent DEP data up to May 31st, 2026 [DEP data date: 07/16/2026]
© MarcelluGas.Org - All right reserved - Contact MarcellusGas.Org for reprint information.
|
There is no Current Royalty Income Data available for
Bedford County, PA
No production reports have been filed for this County
|
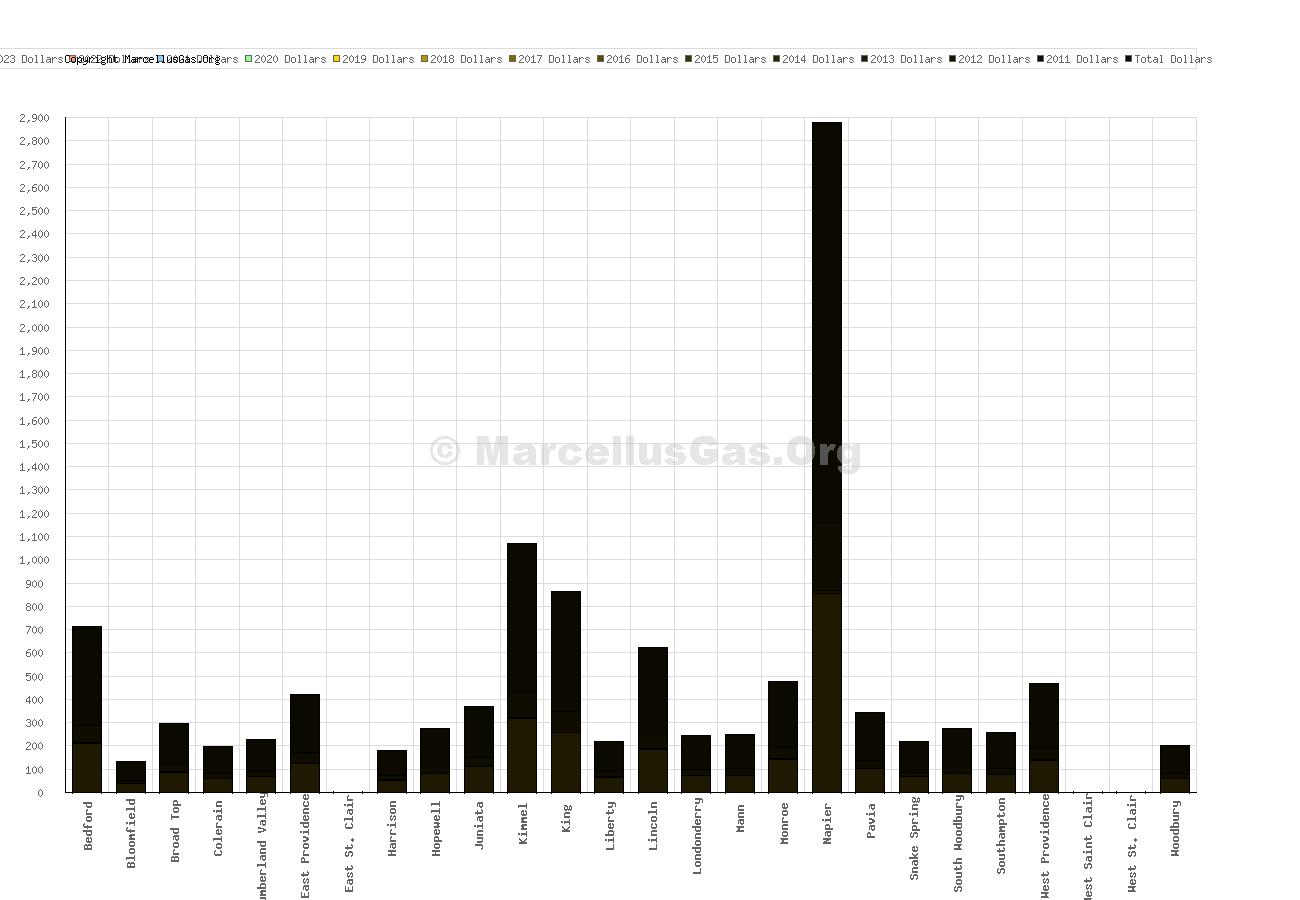
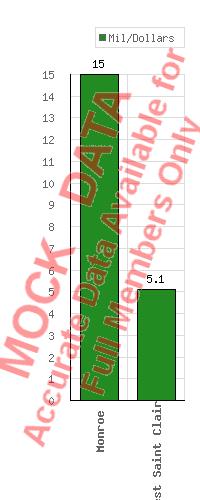
Estimated Lifetime Royalty Revenue from Permitted Wells by Township for Bedford County, Pennsylvania
NOTE: royalty estimates based on crowd sourced ATW values (view crowd sourced pricing page)
(---) dollars: total estimated lifetime royalty revenue,Bedford County, for all permitted unconventional wells (as of Jul 18th, 2026)
(---) Township is the township with the highest estimated lifetime royalty revenue for all permitted unconventional wells: (---) dollars.
Show/Hide Statistical Criteria
|
Graph: Estimated Lifetime Royalty Revenue (in millions of dollars) from Permitted Wells by Township for Bedford County, Pennsylvania
|
|
Bedford County Townships in Alphabetical Order
|
Based on data up to Jul 18th, 2026
© MarcelluGas.Org - All right reserved - Contact MarcellusGas.Org for reprint information.
|
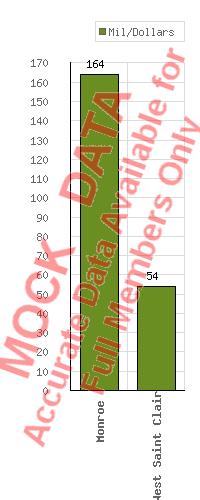
Estimated Lifetime Total Gas Company Revenue for Permitted Wells by Township for Bedford County, Pennsylvania
(---) dollars: total estimated lifetime revenue, Bedford County, for all permitted unconventional wells (as of Jul 18th, 2026)
(---) Township is the township with the highest estimated lifetime revenue for all permitted unconventional wells: (---) dollars.
Show/Hide Statistical Criteria
|
Graph: Estimated Lifetime Total Gas Company Revenue (in millions of dollars) for Permitted Wells by Township for Bedford County, Pennsylvania
|
|
Bedford County Townships in Alphabetical Order
|
Based on data up to Jul 18th, 2026
© MarcelluGas.Org - All right reserved - Contact MarcellusGas.Org for reprint information.
|
There is no Well Production Data available for
Bedford County, PA
No production reports have been filed for this County
|
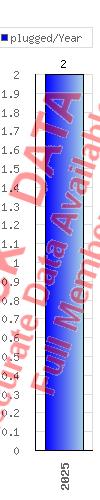
Number of Plugged Wells by Year - Bedford County
|
Based on data up to Jul 18th, 2026
© MarcelluGas.Org - All right reserved - Contact MarcellusGas.Org for reprint information.
|
Estimated DEP Permit Fees by Township for Bedford County, Pennsylvania
(---): total estimated DEP permit fees in Bedford County to date.
(---) Township is the township with the highest estimated DEP permit fees to date ((---)).
Show/Hide Statistical Criteria
|
Graph: Estimated DEP Permit Fees (in thousands of dollars) per Township for Bedford County, Pennsylvania
|
|
Bedford County Townships in Alphabetical Order
|
Based on data up to Jul 18th, 2026
© MarcelluGas.Org - All right reserved - Contact MarcellusGas.Org for reprint information.
|
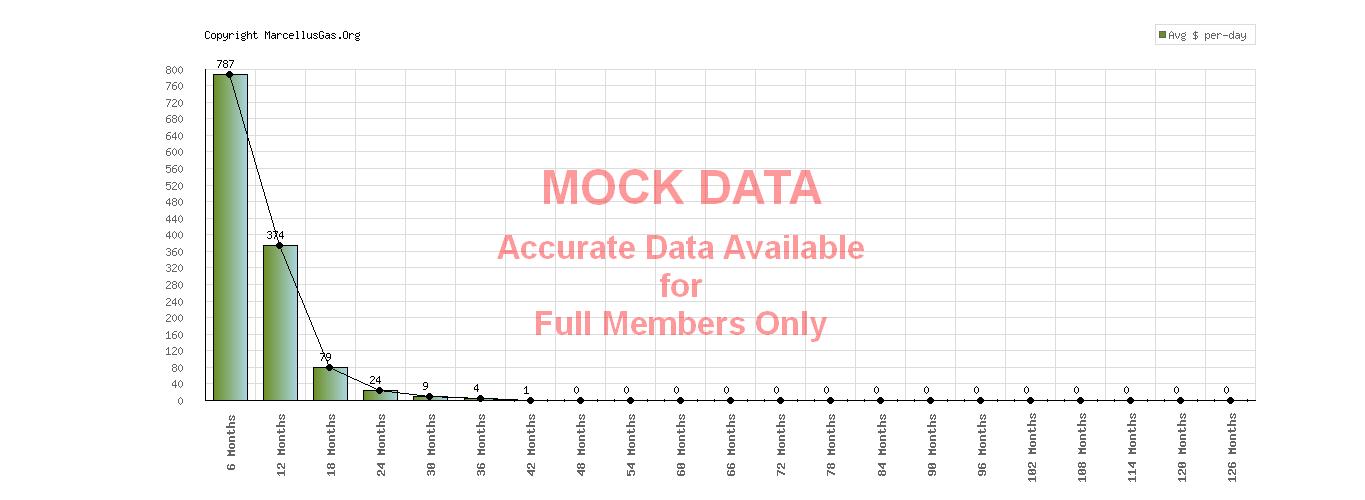
Average Production Drop-Off in 6 Month Segments - Bedford County, Pennsylvania
The graphs below display the average per-day production values
for wells as they progress through 6 month production reporting periods.
(---) qualifying wells were used in per-day production calculations
(---)% - percentage drop in production over reporting period
|
Show/Hide Statistical Criteria
|
Average Production Drop-Off in 6 Month Segments - Bedford County
|
Based on most recent DEP data up to May 31st, 2026 [DEP data date: 07/16/2026]
© MarcelluGas.Org - All right reserved - Contact MarcellusGas.Org for reprint information.
|
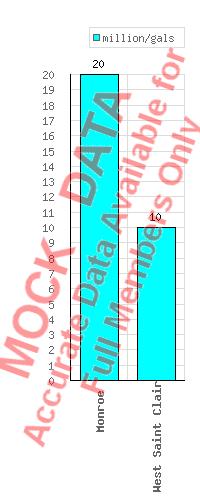
Estimated Anticipated Water Usage (for Hydraulic Fracturing) for Permitted Horizontal Wells, by Township, for Bedford County, Pennsylvania
(---) million gallons: for the entire county of Bedford
(---) million gallons: amount if the on-site fracturing fluid was recyled 100%.
(---): estimated number of 18 wheel tanker truck loads (assuming recycled fracturing fluid).
(---) is the township with the highest estimated anticipated water usage: (---) million gallons ((---) million gallons if on-site fracturing fluid was recycled 100% - aproximately (---) 18 wheel tanker loads).
Show/Hide Statistical Criteria
|
Graph: Estimated Anticipated Water Usage (for Hydraulic Fracturing) of Permitted Horizontal Wells by Township, in Millions of Gallons, for Bedford County, Pennsylvania
|
|
Bedford County Townships in Alphabetical Order
|
Based on data up to Jul 18th, 2026
© MarcelluGas.Org - All right reserved - Contact MarcellusGas.Org for reprint information.
|
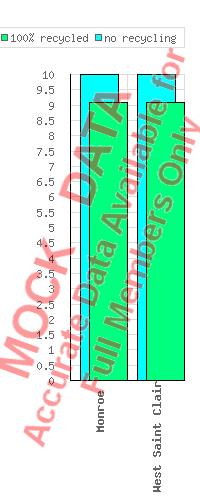
Graph: Estimated Anticipated Recycled Water Usage (for Hydraulic Fracturing) of Permitted Horizontal Wells by Township, in Millions of Gallons, for Bedford County, Pennsylvania
|
|
Bedford County Townships in Alphabetical Order
|
Based on data up to Jul 18th, 2026
© MarcelluGas.Org - All right reserved - Contact MarcellusGas.Org for reprint information.
|
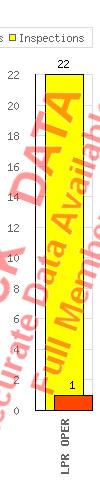
PA DEP Well Inspections and Cited Violations by Township for Bedford County, PA
: the total number of inspections reported in Bedford County to date.
(---) Township is the township with the highest number of inspections to date ((---)).
: the total number of violations reported in Bedford County to date.
(---) Township is the township with the highest number of violations to date ((---)).
Show/Hide Statistical Criteria
|
Graph: PA DEP Well Inspections and Cited Violations per Township for Bedford County, PA
 
|
|
Bedford County Townships in Alphabetical Order
|
Based on PA DEP compliance data up to Jul 18th, 2026
© MarcelluGas.Org - All right reserved - Contact MarcellusGas.Org for reprint information.
|
PA DEP Inspections and Cited Violations per Gas Company for Bedford County, PA
(---): The total number of inspections in Bedford County.
(---): The total number of violations in Bedford County.
|
Graph: PA DEP Inspections and Cited Violations per Gas Company for Bedford County, PA
|
|
Gas Companies in Alphabetical Order
|
Based on PA DEP compliance data up to Jul 18th, 2026
© MarcelluGas.Org - All right reserved - Contact MarcellusGas.Org for reprint information.
|
Graph: PA DEP Inspections and Cited Violations per Year for Bedford County, PA
|
 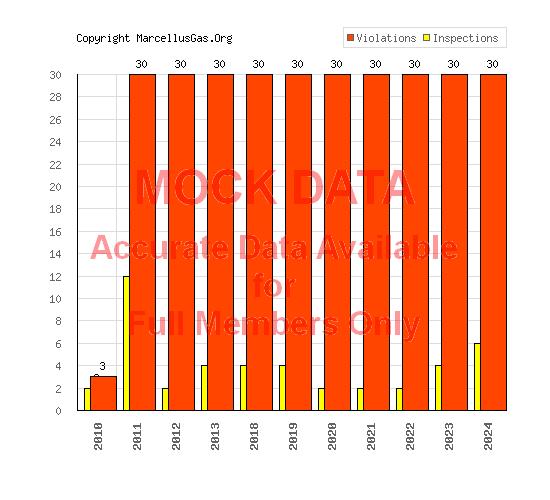
|
Based on PA DEP compliance data up to Jul 18th, 2026
© MarcelluGas.Org - All right reserved - Contact MarcellusGas.Org for reprint information.
|
Graph: Average Number of PA DEP Inspections and Cited Violations per Well by Year for Bedford County, PA
|
 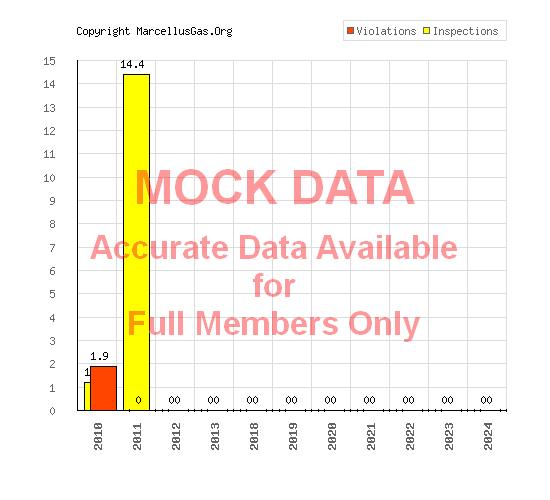
|
Based on PA DEP compliance data up to Jul 18th, 2026
© MarcelluGas.Org - All right reserved - Contact MarcellusGas.Org for reprint information.
|
Comparison of Horizontal Wells to Vertical Wells by Township for Bedford County, Pennsylvania
(---): the total number of permitted horizontal wells in Bedford County to date.
(---): the total number of permitted vertical wells in Bedford County to date.
(---) Township is the township with the highest number of permitted horizontal wells to date ((---)).
(---) Township is the township with the highest number of permitted verticall wells to date ((---)).
|
Graph: Horizontal and Vertical Permitted Wells per Township for Bedford County, Pennsylvania
 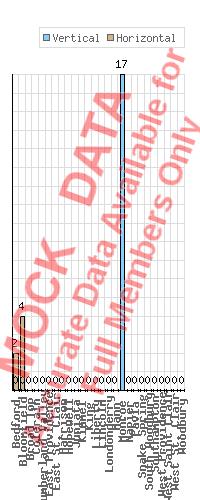
|
|
Bedford County Townships in Alphabetical Order
|
Based on data up to Jul 18th, 2026
© MarcelluGas.Org - All right reserved - Contact MarcellusGas.Org for reprint information.
|
Permitted Gas Wells by Company for Bedford County, Pennsylvania
(---): the total number of gas companys with permitted wells in Bedford County to date.
|
Graph: Number of Permitted Wells by Gas Company for Bedford County, Pennsylvania
 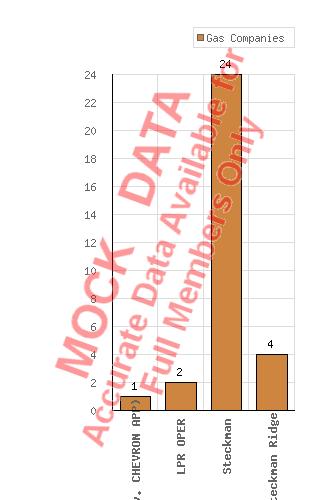
|
|
Bedford Gas Companies in Alphabetical Order
|
Based on data up to Jul 18th, 2026
© MarcelluGas.Org - All right reserved - Contact MarcellusGas.Org for reprint information.
|
Liquid Waste, by Type, for Bedford County, Pennsylvania
|
gallons: the total amount of liquid unconventional well waste produced in Bedford County up to May 31st, 2026 [DEP data date: 07/16/2026]. This is equivilent to aproximately 18 wheeler tanker truckloads.
Show/Hide Statistical Criteria
Graph: Liquid Waste in Gallons, by Type: Bedford County, Pennsylvania
|
|
Types of Liquid Waste
|
Based on DEP data thru Apr. 30th, 2015
|
|
|
|