|
|
Information Related to Pennsylvania Deep Gas Well Activity
|
|
|
|
|
|
Complete County & State Statistics are only available to Full Members
Full Members have access to the many features available at MarcellusGas.Org - Become a Full Member
Close This Box
|
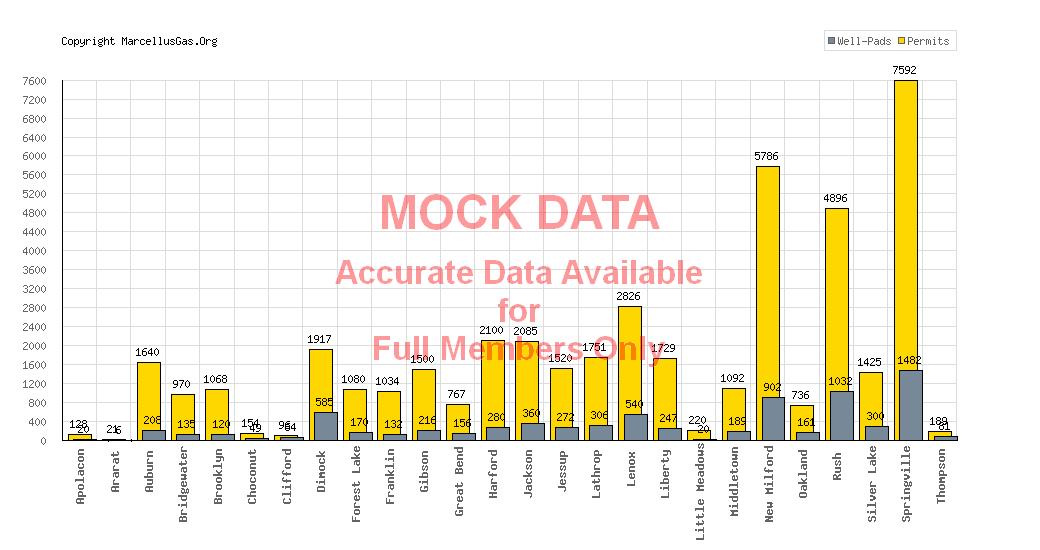
Permitted Unconventional Wells and Well-Pads by Township for Susquehanna County, Pennsylvania
(---): the total number of permitted wells in Susquehanna County to date.
(---) Township is the township with the highest number of permitted wells to date ((---)).
(---): the total number of permitted well-pads in Susquehanna County to date.
|
Graph: Unconventional Well Permits & Well-Pads per Township for Susquehanna County, Pennsylvania
|
|
Susquehanna County Townships in Alphabetical Order
|
Based on data up to Jul 5th, 2026
© MarcelluGas.Org - All right reserved - Contact MarcellusGas.Org for reprint information.
|
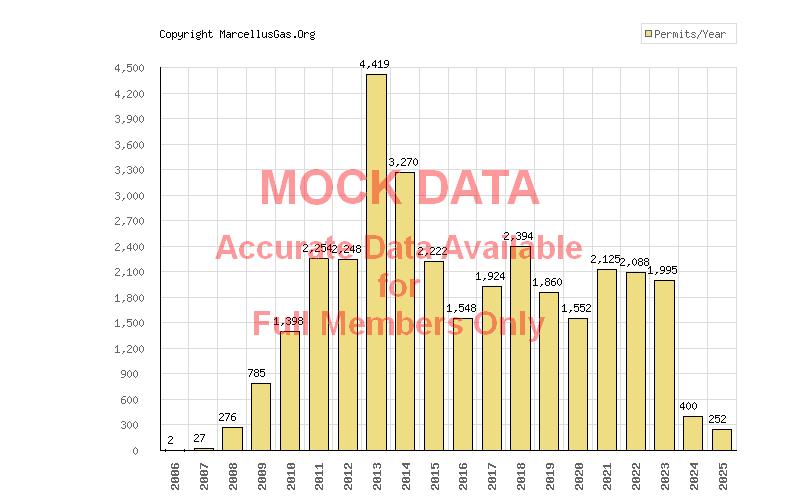
Graph: Unconventional Well Permits by Year for Susquehanna County, Pennsylvania
|
|
Years in chronological order - current year represents permits approved as of Jul 5th, 2026 |
Based on data up to Jul 5th, 2026
© MarcelluGas.Org - All right reserved - Contact MarcellusGas.Org for reprint information.
|
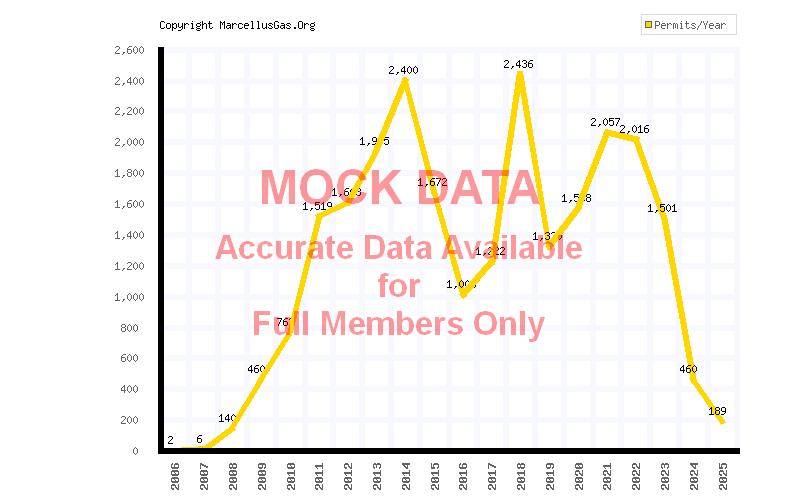
Graph: Unconventional Well Starts by Year for Susquehanna County, Pennsylvania
|
|
Years in chronological order - current year represents the number of wells started as of Jul 5th, 2026 |
© MarcelluGas.Org - All right reserved - Contact MarcellusGas.Org for reprint information.
|
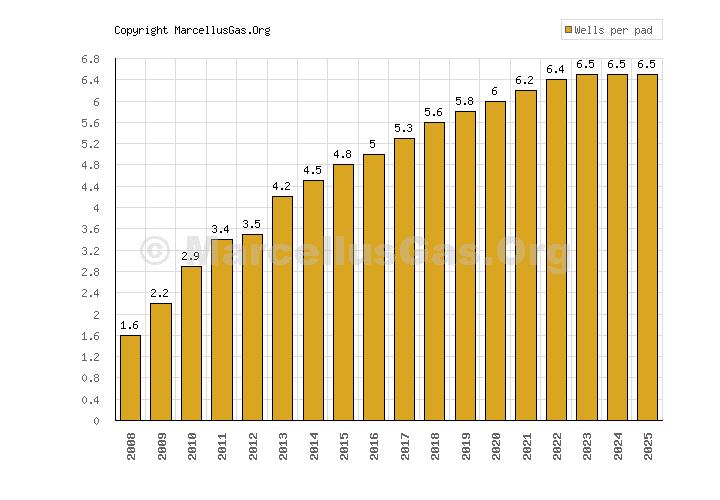
Graph: Average Number of Permitted Wells per Well Site by Year for Susquehanna County, Pennsylvania
|
|
Yearly tallies are cumulative - only well-pads with multiple wells are considered.
|
Based on data up to Jul 5th, 2026
© MarcelluGas.Org - All right reserved - Contact MarcellusGas.Org for reprint information.
|
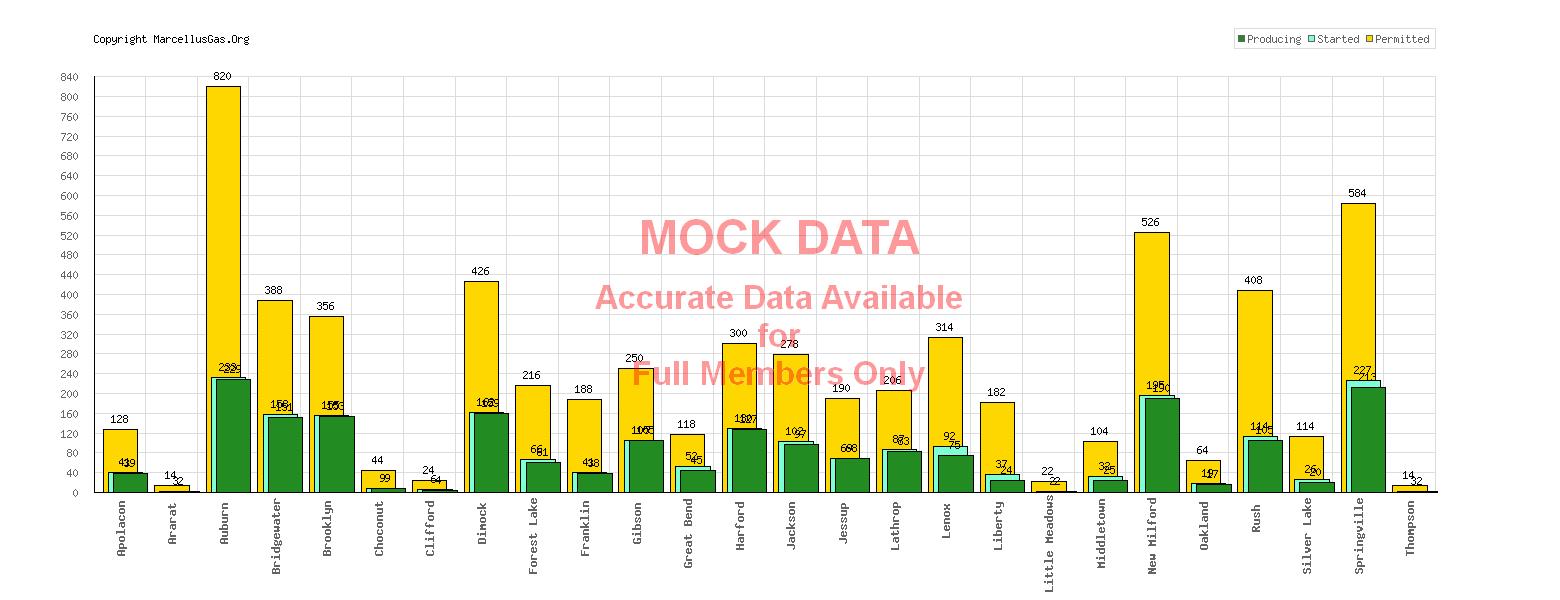
Graph: Unconventional Well Status: Producing, Started, Permitted - by Township for Susquehanna County, Pennsylvania
|
Susquehanna County Townships in Alphabetical Order
|
Permitted and Started wells based on DEP data as of Jul 5th, 2026
Producing wells based on DEP data as of Apr 31st, 2026 [DEP data date: 06/18/2026] (most recent available from DEP)
© MarcelluGas.Org - All right reserved - Contact MarcellusGas.Org for reprint information.
|
Estimated Current Royalty Income by Township for Susquehanna County, Pennsylvania
NOTE: royalty estimates based on crowd sourced ATW values (view crowd sourced pricing page)
(---): estimated current royalty income in millions of dollars for Susquehanna County as of Apr 31st, 2026 [DEP data date: 06/18/2026].
(---) Township, Susquehanna county has the highest estimated current royalty income: (---) dollars.
Show/Hide Statistical Criteria
|
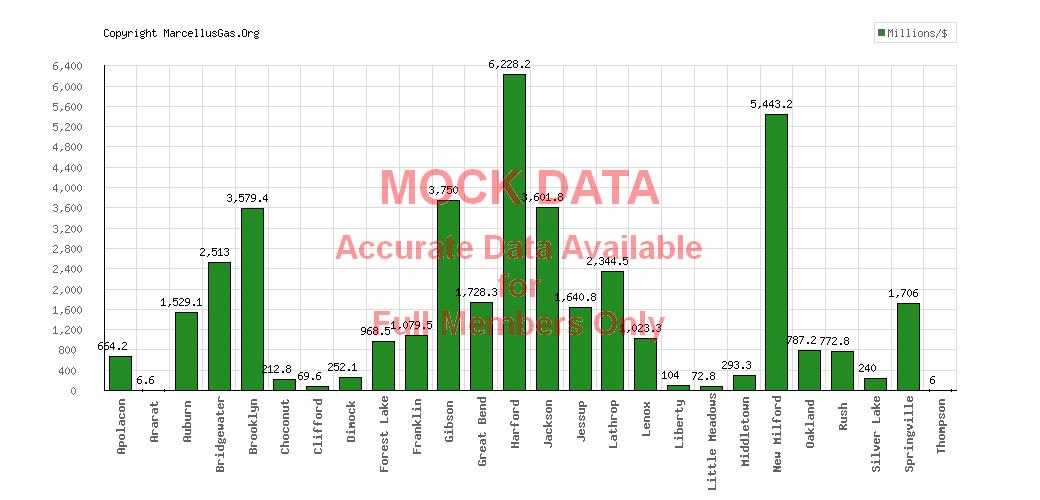
Graph: Estimated Current Royalty Income for Producing Wells per Township for Susquehanna County, Pennsylvania
|
|
Susquehanna County Townships in Alphabetical Order
|
Based on most recent DEP data up to Apr 31st, 2026 [DEP data date: 06/18/2026]
© MarcelluGas.Org - All right reserved - Contact MarcellusGas.Org for reprint information.
|
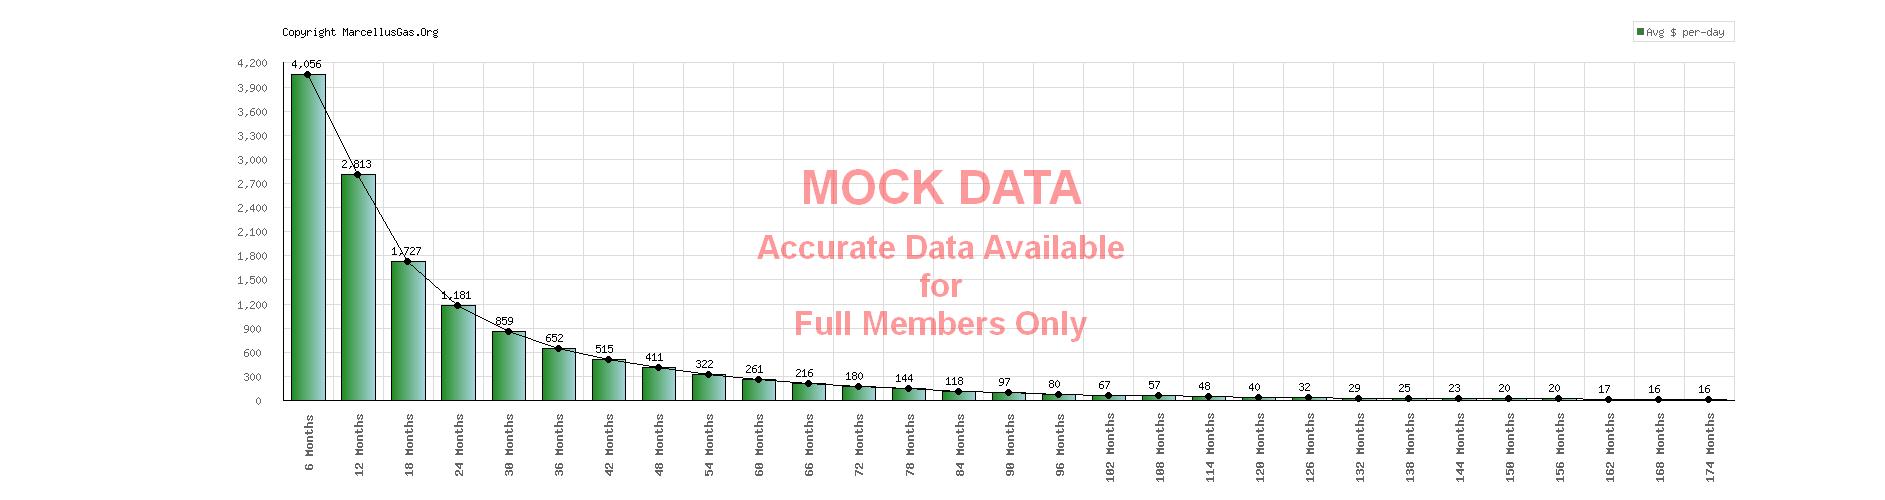
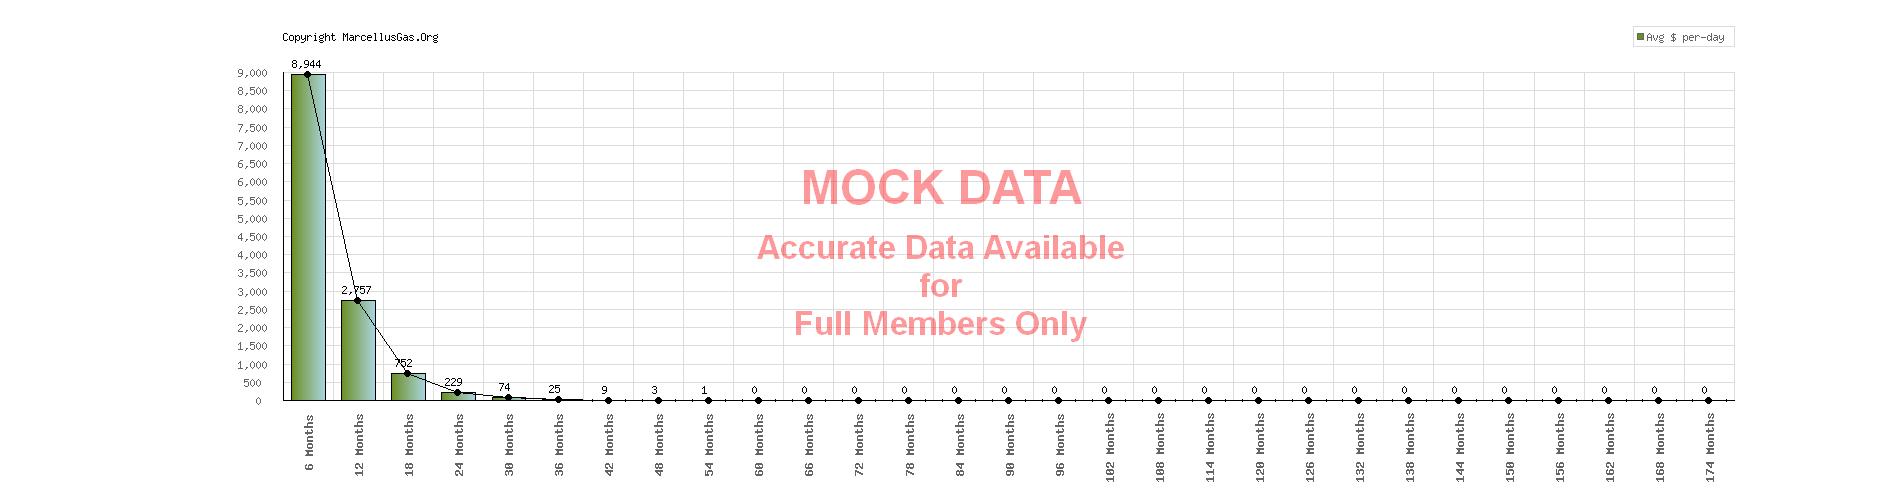
Average Per-Day Estimated Royalties/Per-Day Production in 6 Month Segments - Susquehanna County, Pennsylvania
NOTE: royalty estimates based on crowd sourced ATW values (view crowd sourced pricing page)
The graphs below display the average per-day production values
for wells as they progress through 6 month production reporting periods.
(---) qualifying wells were used in per-day production calculations
(---)% - percentage drop in production over reporting period
|
Show/Hide Statistical Criteria
|
Average Per-Day Values in 6 Month Segments - Susquehanna County
|
Based on most recent DEP data up to Apr 31st, 2026 [DEP data date: 06/18/2026]
© MarcelluGas.Org - All right reserved - Contact MarcellusGas.Org for reprint information.
|
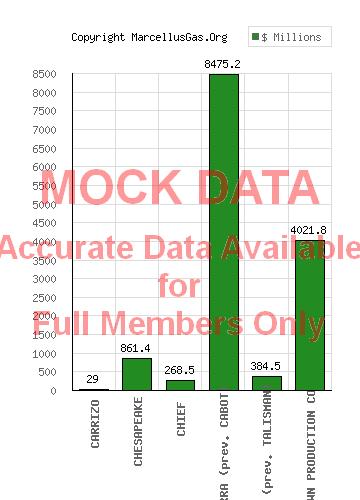
Estimated Royalty Payments, by Gas Company, for Susquehanna County, Pennsylvania
NOTE: estimates based on crowd sourced ATW values (view crowd sourced pricing page)
(---): estimated current royalty income in millions of dollars for Susquehanna County as of Apr 31st, 2026 [DEP data date: 06/18/2026].
(---) is the Gas Company with the highest estimated royalty payments to date of dollars, in Susquehanna County.
Show/Hide Statistical Criteria
|
Graph: Estimated Royalty Payments, by Gas Company, for Susquehanna County, Pennsylvania
|
|
Gas Companies in Alphabetical Order
|
Based on most recent DEP data up to Apr 31st, 2026 [DEP data date: 06/18/2026]
© MarcelluGas.Org - All right reserved - Contact MarcellusGas.Org for reprint information.
|
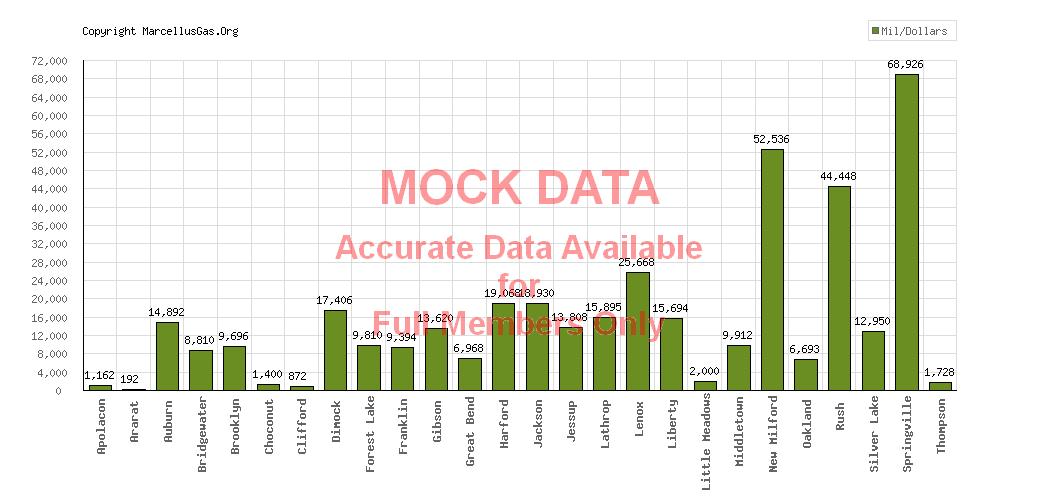
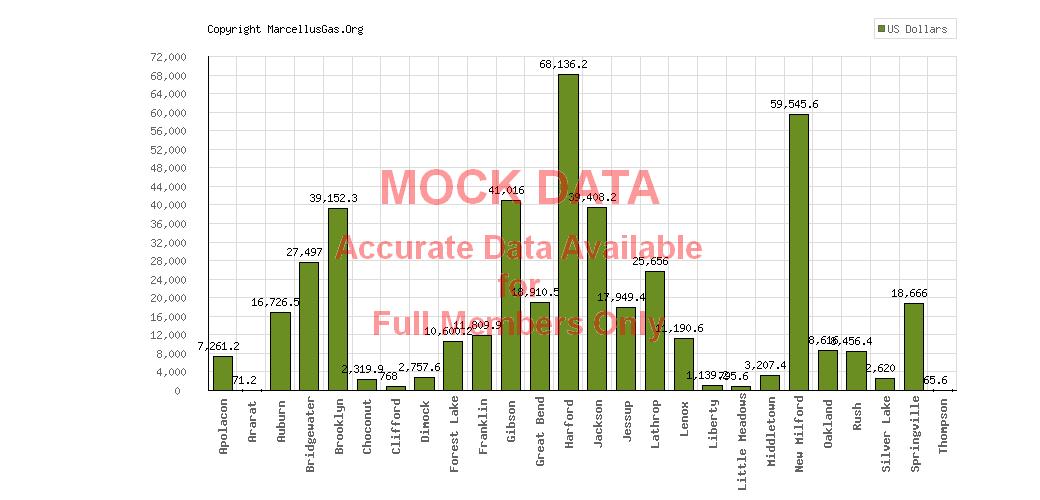
Estimated Lifetime Royalty Revenue from Permitted Wells by Township for Susquehanna County, Pennsylvania
NOTE: royalty estimates based on crowd sourced ATW values (view crowd sourced pricing page)
(---) dollars: total estimated lifetime royalty revenue,Susquehanna County, for all permitted unconventional wells (as of Jul 5th, 2026)
(---) Township is the township with the highest estimated lifetime royalty revenue for all permitted unconventional wells: (---) dollars.
Show/Hide Statistical Criteria
|
Graph: Estimated Lifetime Royalty Revenue (in millions of dollars) from Permitted Wells by Township for Susquehanna County, Pennsylvania
|
|
Susquehanna County Townships in Alphabetical Order
|
Based on data up to Jul 5th, 2026
© MarcelluGas.Org - All right reserved - Contact MarcellusGas.Org for reprint information.
|
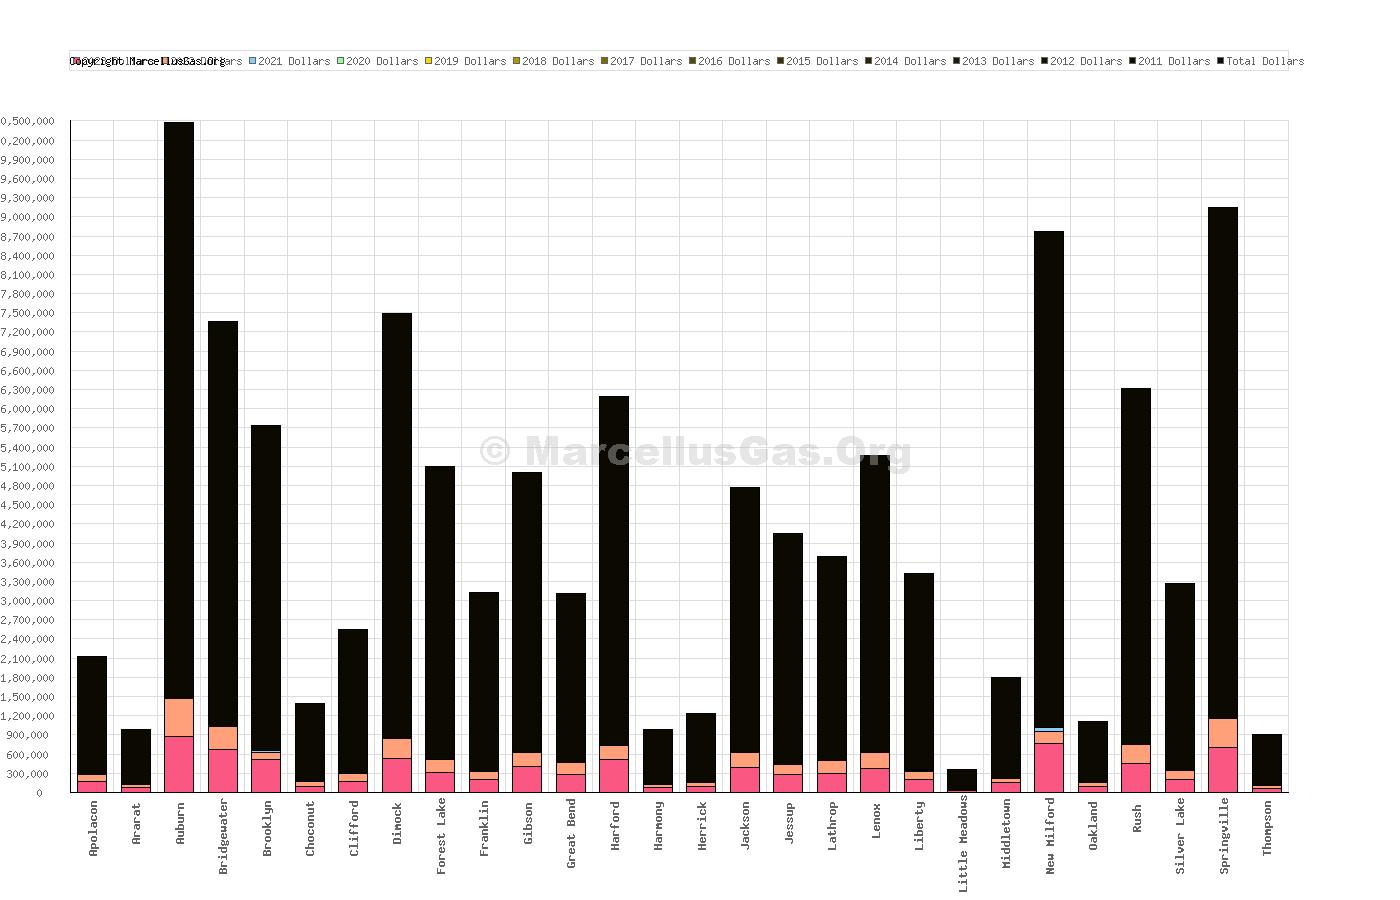
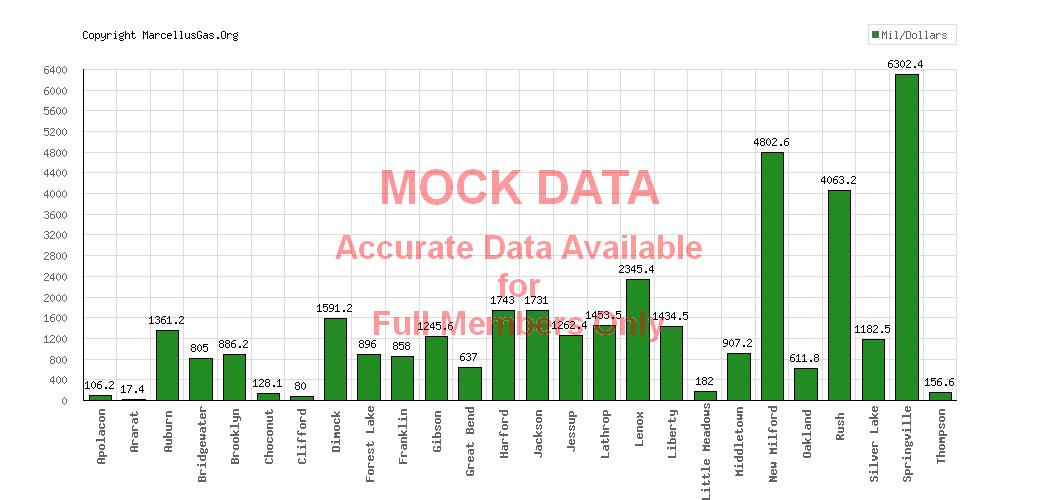
Estimated Lifetime Total Gas Company Revenue for Permitted Wells by Township for Susquehanna County, Pennsylvania
(---) dollars: total estimated lifetime revenue, Susquehanna County, for all permitted unconventional wells (as of Jul 5th, 2026)
(---) Township is the township with the highest estimated lifetime revenue for all permitted unconventional wells: (---) dollars.
Show/Hide Statistical Criteria
|
Graph: Estimated Lifetime Total Gas Company Revenue (in millions of dollars) for Permitted Wells by Township for Susquehanna County, Pennsylvania
|
|
Susquehanna County Townships in Alphabetical Order
|
Based on data up to Jul 5th, 2026
© MarcelluGas.Org - All right reserved - Contact MarcellusGas.Org for reprint information.
|
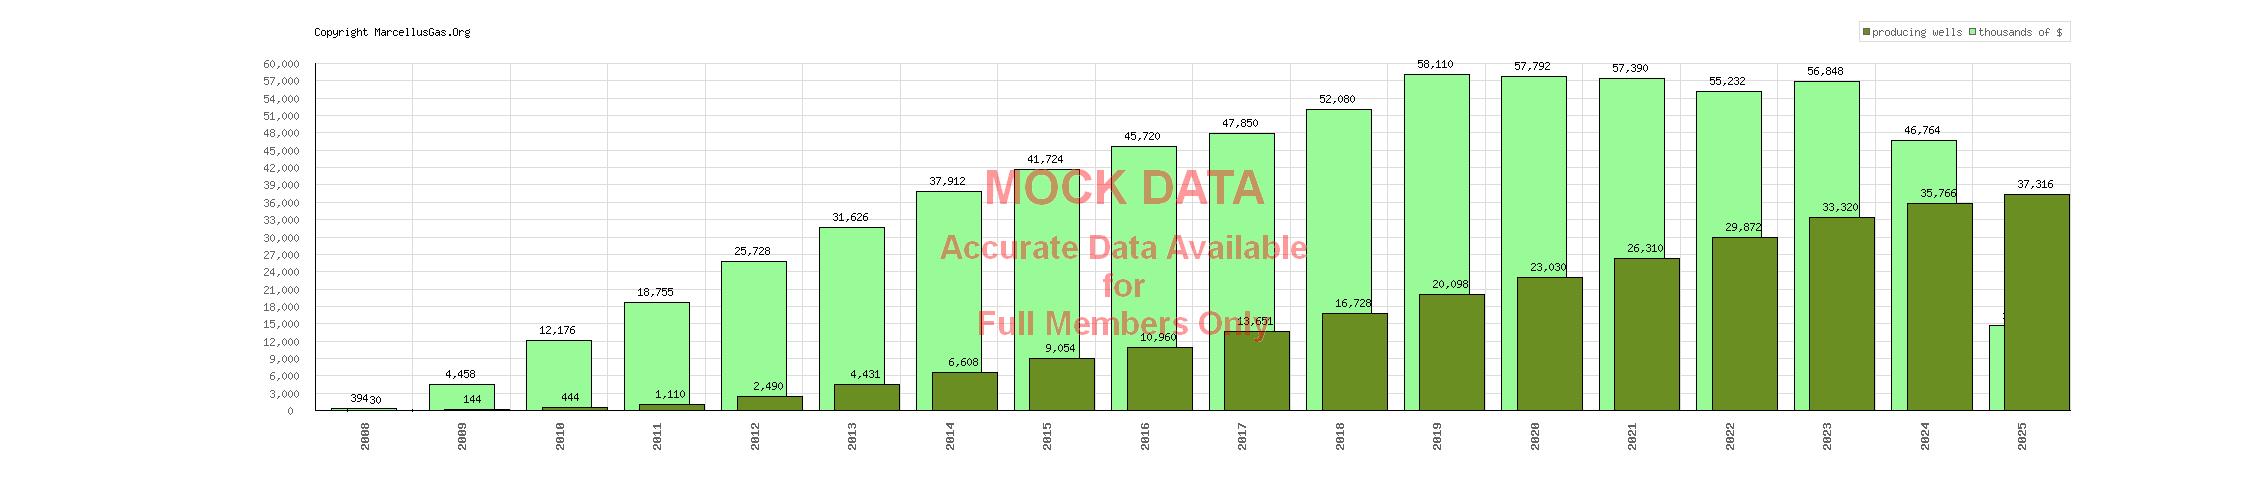
Graph: Average Production per Well, by Year, Susquehanna County, Pennsylvania
The dollar values shown represent the production average, in thousands of dollars, per well. Values are based on "At The Wellhead" (ATW) pricing of $3.34 per MCF (thousand cubic feet) - the most recent pricing figure available from the U.S. Energy Information Administration. The darker bar represents the number of wells with reported production values during that year.
|
|
Based on most recent DEP data up to Apr 31st, 2026 [DEP data date: 06/18/2026]
© MarcelluGas.Org - All right reserved - Contact MarcellusGas.Org for reprint information.
|
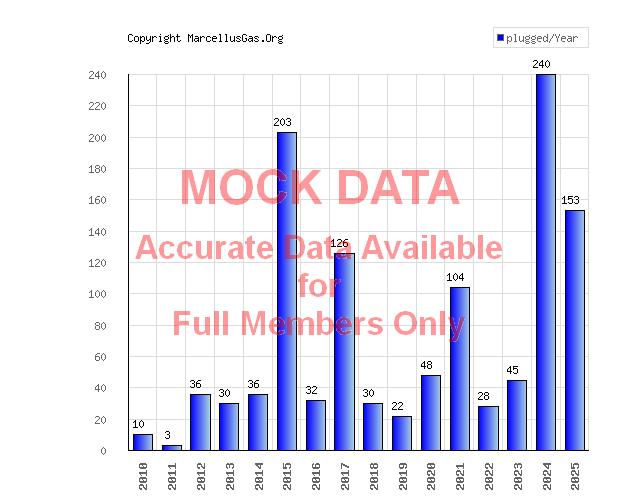
Number of Plugged Wells by Year - Susquehanna County
|
Based on data up to Jul 5th, 2026
© MarcelluGas.Org - All right reserved - Contact MarcellusGas.Org for reprint information.
|
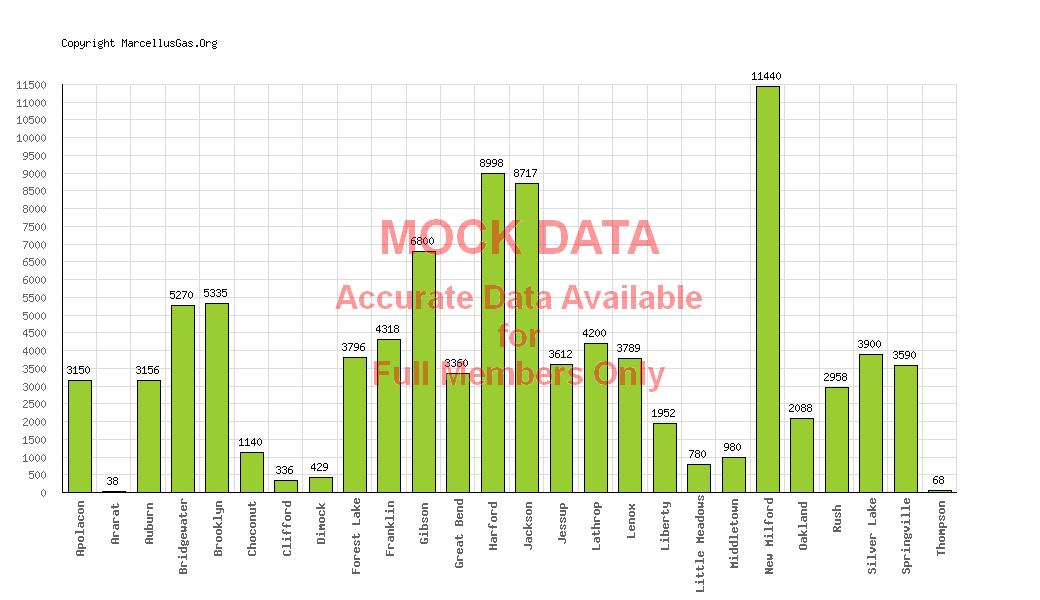
Estimated DEP Permit Fees by Township for Susquehanna County, Pennsylvania
(---): total estimated DEP permit fees in Susquehanna County to date.
(---) Township is the township with the highest estimated DEP permit fees to date ((---)).
Show/Hide Statistical Criteria
|
Graph: Estimated DEP Permit Fees (in thousands of dollars) per Township for Susquehanna County, Pennsylvania
|
|
Susquehanna County Townships in Alphabetical Order
|
Based on data up to Jul 5th, 2026
© MarcelluGas.Org - All right reserved - Contact MarcellusGas.Org for reprint information.
|
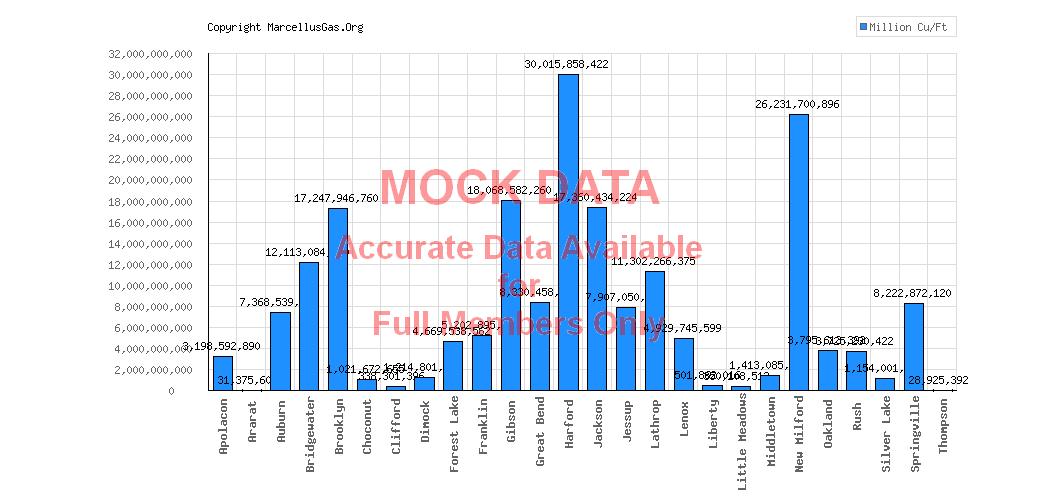
Unconventional Gas Well Production Values for Susquehanna County, Pennsylvania
(---): the value of gas produced in Susquehanna County, Pennsylvania to date, based on an adjusted total reported production volume of (---) thousand cubic feet (Mcf), and a wellhead price of $ 3.34 per Mcf.
(---) dollars: the value of gas produced in Susquehanna County to date, based on a residential price of $ 18.17 per Mcf.
(---): the number of homes this amount of gas would heat for a period of one year.
(---) dollars: the estimated revenue from an at the wellhead value severance tax of 5%.
Township is the township with the highest "at the well head" production values to date of dollars, based on an adjusted total reported production of Mcf. This translates to a residential pricing value of dollars, and would heat aproximately homes for one year and genearate an estimated (---) dollars in severance tax revenue at 5%.
Show/Hide Statistical Criteria
|
Graph: Wellhead Dollar Value of Produced Gas per Township for Susquehanna County, Pennsylvania
|
|
Susquehanna County Townships in Alphabetical Order
|
Based on most recent DEP data up to Apr 31st, 2026 [DEP data date: 06/18/2026]
© MarcelluGas.Org - All right reserved - Contact MarcellusGas.Org for reprint information.
|
Graph: Gas Production (Mcf) per Township for Susquehanna County, Pennsylvania
|
|
Susquehanna County Townships in Alphabetical Order
|
Based on most recent DEP data up to Apr 31st, 2026 [DEP data date: 06/18/2026]
© MarcelluGas.Org - All right reserved - Contact MarcellusGas.Org for reprint information.
|
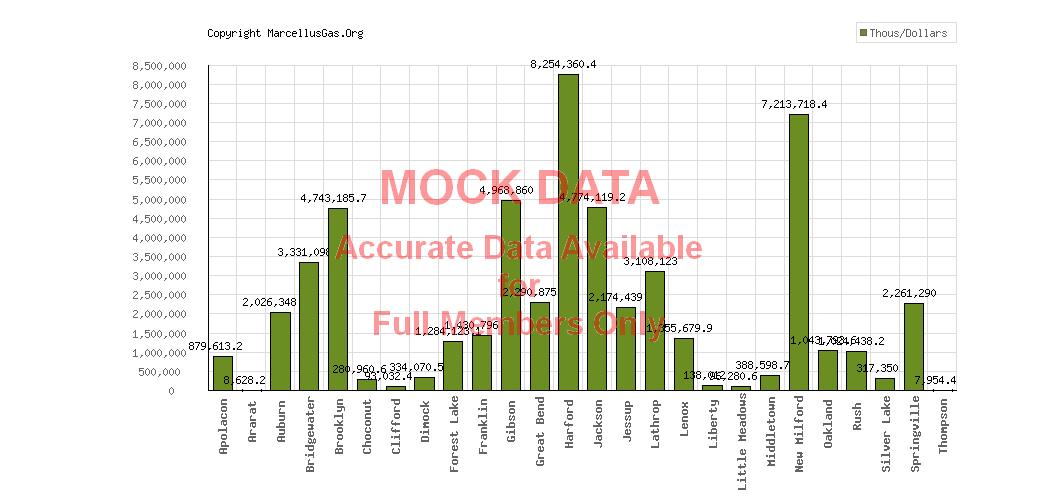
Graph: Estimated Severance Tax Revenue (Thousands of Dollars at 5%) for Susquehanna County, Pennsylvania
|
|
Susquehanna County Townships in Alphabetical Order
|
Based on most recent DEP data up to Apr 31st, 2026 [DEP data date: 06/18/2026]
© MarcelluGas.Org - All right reserved - Contact MarcellusGas.Org for reprint information.
|
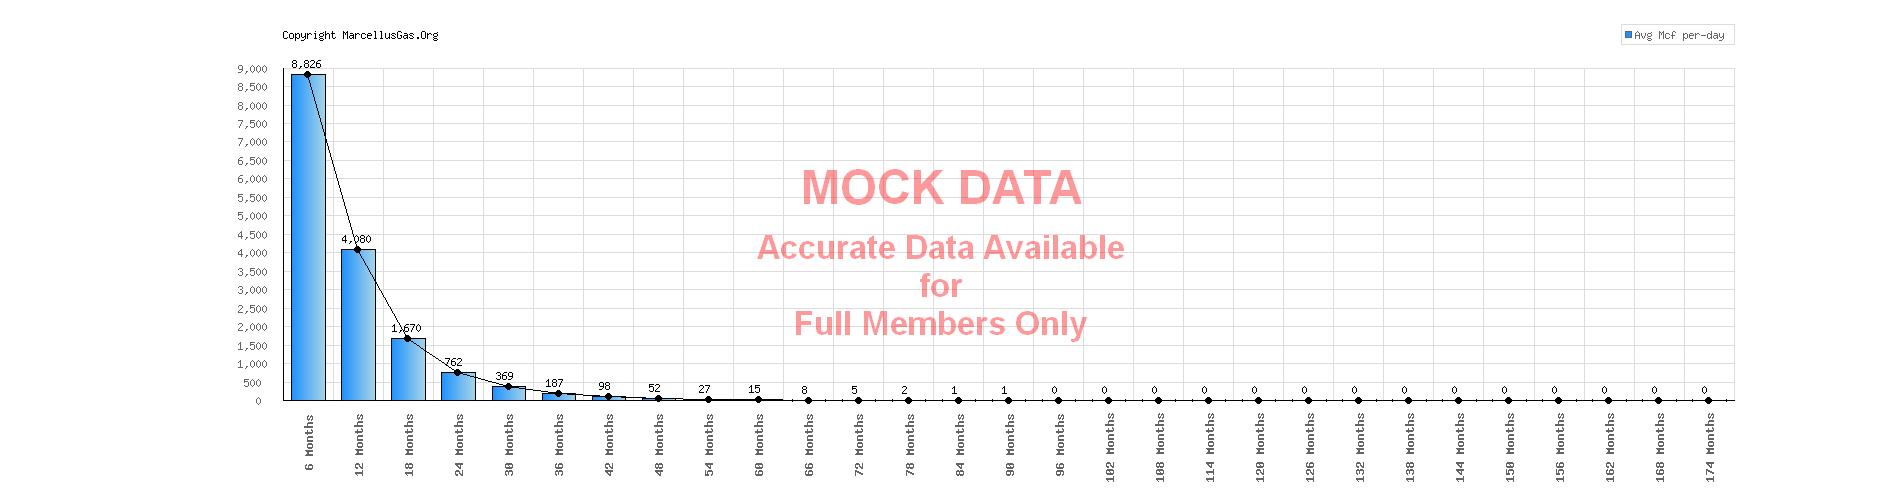
Average Production Drop-Off in 6 Month Segments - Susquehanna County, Pennsylvania
The graphs below display the average per-day production values
for wells as they progress through 6 month production reporting periods.
(---) qualifying wells were used in per-day production calculations
(---)% - percentage drop in production over reporting period
|
Show/Hide Statistical Criteria
|
Average Production Drop-Off in 6 Month Segments - Susquehanna County
|
Based on most recent DEP data up to Apr 31st, 2026 [DEP data date: 06/18/2026]
© MarcelluGas.Org - All right reserved - Contact MarcellusGas.Org for reprint information.
|
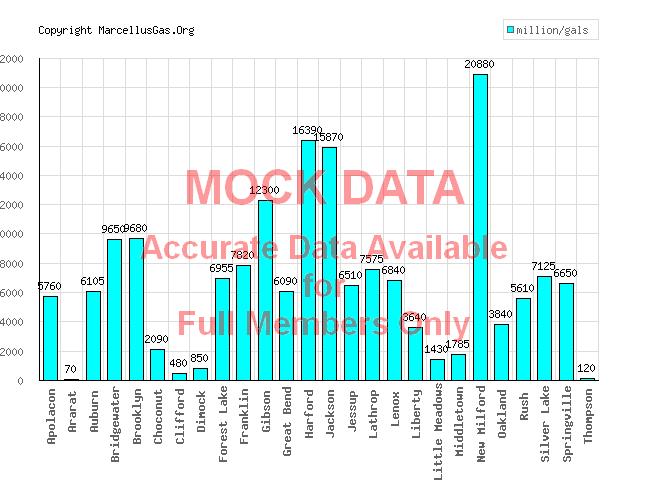
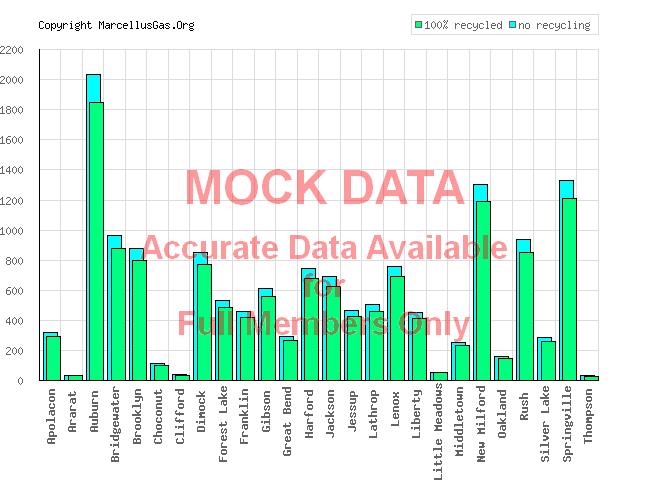
Estimated Anticipated Water Usage (for Hydraulic Fracturing) for Permitted Horizontal Wells, by Township, for Susquehanna County, Pennsylvania
(---) million gallons: for the entire county of Susquehanna
(---) million gallons: amount if the on-site fracturing fluid was recyled 100%.
(---): estimated number of 18 wheel tanker truck loads (assuming recycled fracturing fluid).
(---) is the township with the highest estimated anticipated water usage: (---) million gallons ((---) million gallons if on-site fracturing fluid was recycled 100% - aproximately (---) 18 wheel tanker loads).
Show/Hide Statistical Criteria
|
Graph: Estimated Anticipated Water Usage (for Hydraulic Fracturing) of Permitted Horizontal Wells by Township, in Millions of Gallons, for Susquehanna County, Pennsylvania
|
|
Susquehanna County Townships in Alphabetical Order
|
Based on data up to Jul 5th, 2026
© MarcelluGas.Org - All right reserved - Contact MarcellusGas.Org for reprint information.
|
Graph: Estimated Anticipated Recycled Water Usage (for Hydraulic Fracturing) of Permitted Horizontal Wells by Township, in Millions of Gallons, for Susquehanna County, Pennsylvania
|
|
Susquehanna County Townships in Alphabetical Order
|
Based on data up to Jul 5th, 2026
© MarcelluGas.Org - All right reserved - Contact MarcellusGas.Org for reprint information.
|
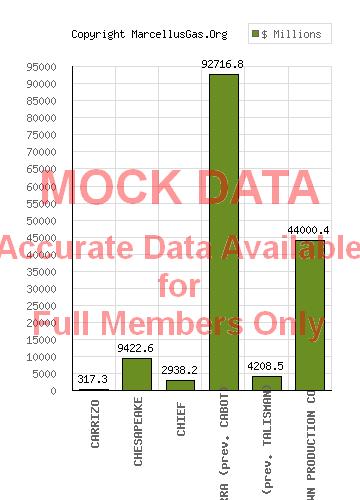
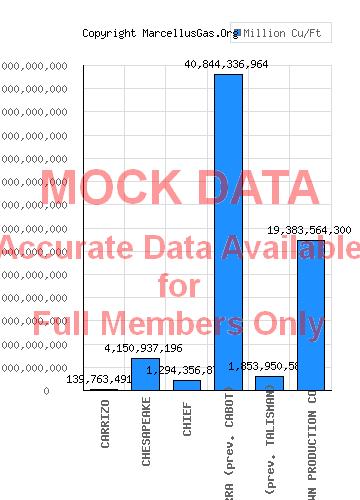
Unconventional Gas Well Production Values per Gas Company for Susquehanna County, Pennsylvania
(---): the value of gas produced in Susquehanna County, Pennsylvania to date, based on an adjusted total reported production volume of (---) thousand cubic feet (Mcf), and a wellhead price of $ 3.34 per Mcf.
(---) dollars: the value of gas produced in Susquehanna County to date, based on a residential price of $ 18.17 per Mcf.
(---): the number of homes this amount of gas would heat for a period of one year.
(---) is the Gas Company with the highest "at the well head" production values to date of dollars, in Susquehanna County, based on an adjusted total reported production of Mcf. This translates to a residential pricing value of dollars, and would heat aproximately homes for one year.
Show/Hide Statistical Criteria
|
Graph: Wellhead Dollar Value of Produced Gas per Gas Company for Susquehanna County, Pennsylvania
|
|
Susquehanna County Townships in Alphabetical Order
|
Based on most recent DEP data up to Apr 31st, 2026 [DEP data date: 06/18/2026]
© MarcelluGas.Org - All right reserved - Contact MarcellusGas.Org for reprint information.
|
Graph: Gas Production (Mcf) per Gas Company for Susquehanna County, Pennsylvania
|
|
Susquehanna County Townships in Alphabetical Order
|
Based on most recent DEP data up to Apr 31st, 2026 [DEP data date: 06/18/2026]
© MarcelluGas.Org - All right reserved - Contact MarcellusGas.Org for reprint information.
|
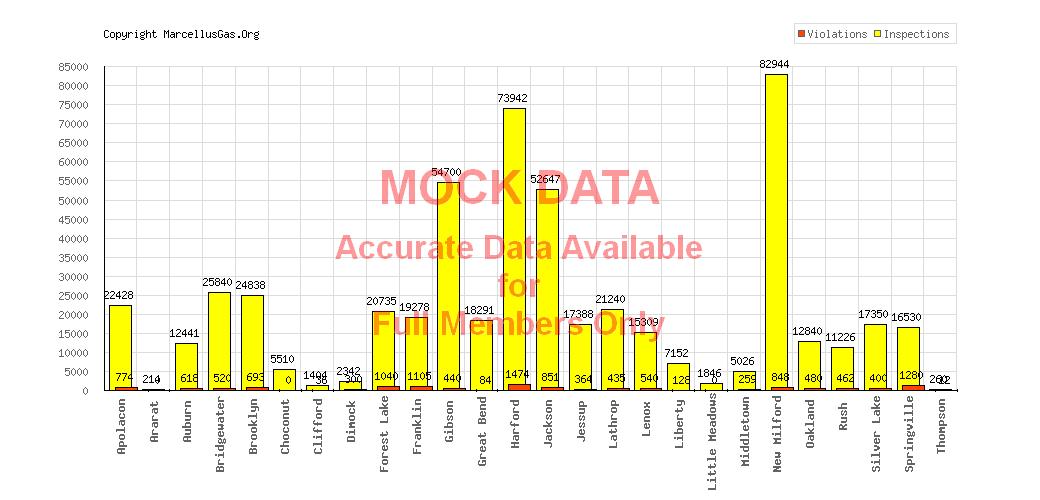
PA DEP Well Inspections and Cited Violations by Township for Susquehanna County, PA
: the total number of inspections reported in Susquehanna County to date.
(---) Township is the township with the highest number of inspections to date ((---)).
: the total number of violations reported in Susquehanna County to date.
(---) Township is the township with the highest number of violations to date ((---)).
Show/Hide Statistical Criteria
|
Graph: PA DEP Well Inspections and Cited Violations per Township for Susquehanna County, PA
|
|
Susquehanna County Townships in Alphabetical Order
|
Based on PA DEP compliance data up to Jul 5th, 2026
© MarcelluGas.Org - All right reserved - Contact MarcellusGas.Org for reprint information.
|
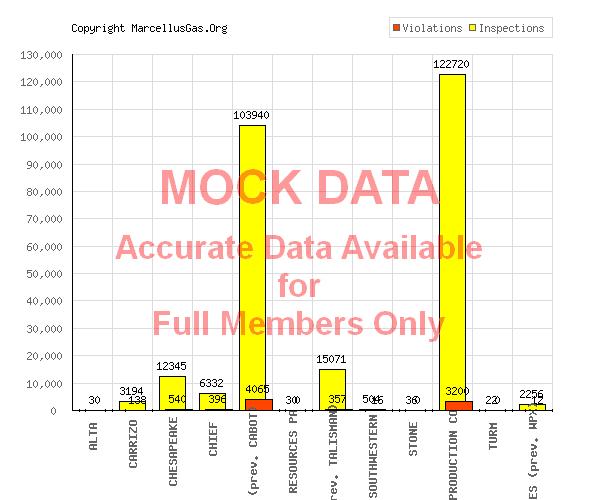
PA DEP Inspections and Cited Violations per Gas Company for Susquehanna County, PA
(---): The total number of inspections in Susquehanna County.
(---): The total number of violations in Susquehanna County.
|
Graph: PA DEP Inspections and Cited Violations per Gas Company for Susquehanna County, PA
|
|
Gas Companies in Alphabetical Order
|
Based on PA DEP compliance data up to Jul 5th, 2026
© MarcelluGas.Org - All right reserved - Contact MarcellusGas.Org for reprint information.
|
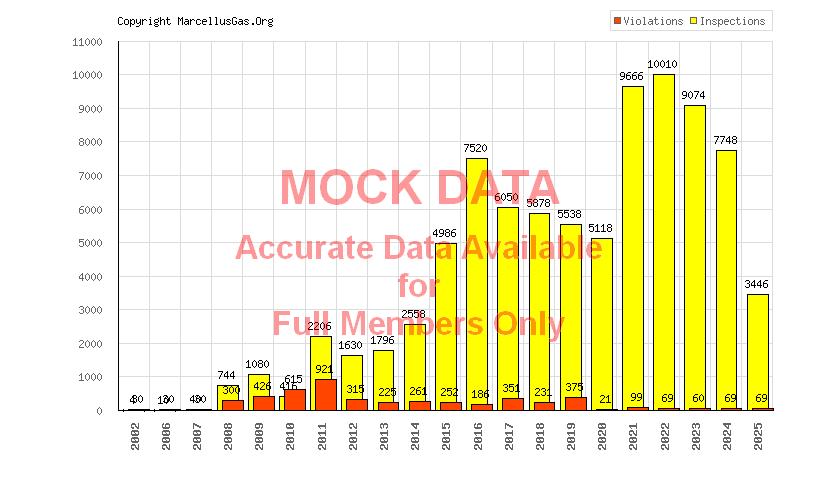
Graph: PA DEP Inspections and Cited Violations per Year for Susquehanna County, PA
|
|
Based on PA DEP compliance data up to Jul 5th, 2026
© MarcelluGas.Org - All right reserved - Contact MarcellusGas.Org for reprint information.
|
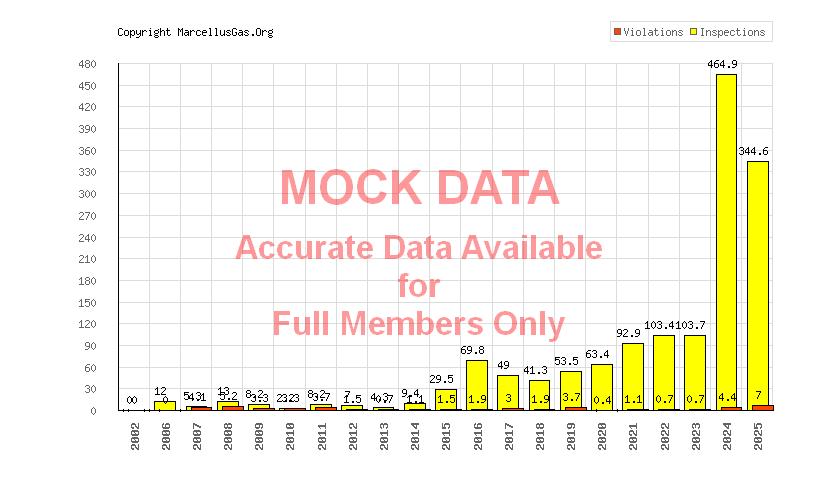
Graph: Average Number of PA DEP Inspections and Cited Violations per Well by Year for Susquehanna County, PA
|
|
Based on PA DEP compliance data up to Jul 5th, 2026
© MarcelluGas.Org - All right reserved - Contact MarcellusGas.Org for reprint information.
|
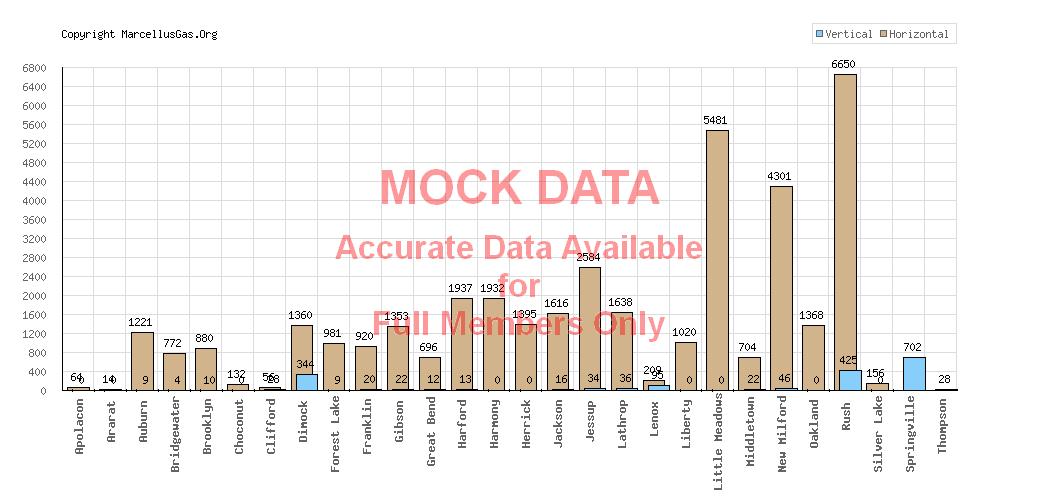
Comparison of Horizontal Wells to Vertical Wells by Township for Susquehanna County, Pennsylvania
(---): the total number of permitted horizontal wells in Susquehanna County to date.
(---): the total number of permitted vertical wells in Susquehanna County to date.
(---) Township is the township with the highest number of permitted horizontal wells to date ((---)).
(---) Township is the township with the highest number of permitted verticall wells to date ((---)).
|
Graph: Horizontal and Vertical Permitted Wells per Township for Susquehanna County, Pennsylvania
|
|
Susquehanna County Townships in Alphabetical Order
|
Based on data up to Jul 5th, 2026
© MarcelluGas.Org - All right reserved - Contact MarcellusGas.Org for reprint information.
|
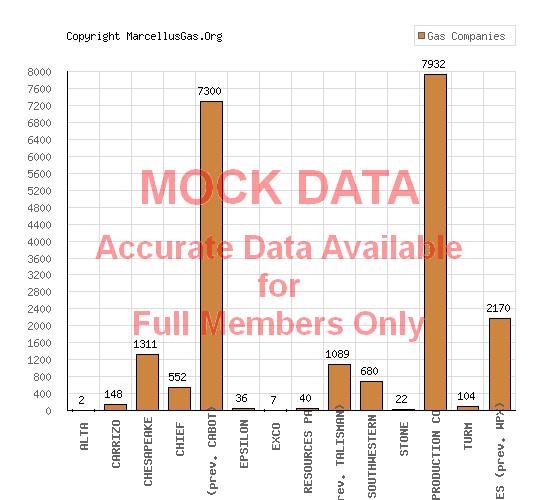
Permitted Gas Wells by Company for Susquehanna County, Pennsylvania
(---): the total number of gas companys with permitted wells in Susquehanna County to date.
|
Graph: Number of Permitted Wells by Gas Company for Susquehanna County, Pennsylvania
|
|
Susquehanna Gas Companies in Alphabetical Order
|
Based on data up to Jul 5th, 2026
© MarcelluGas.Org - All right reserved - Contact MarcellusGas.Org for reprint information.
|
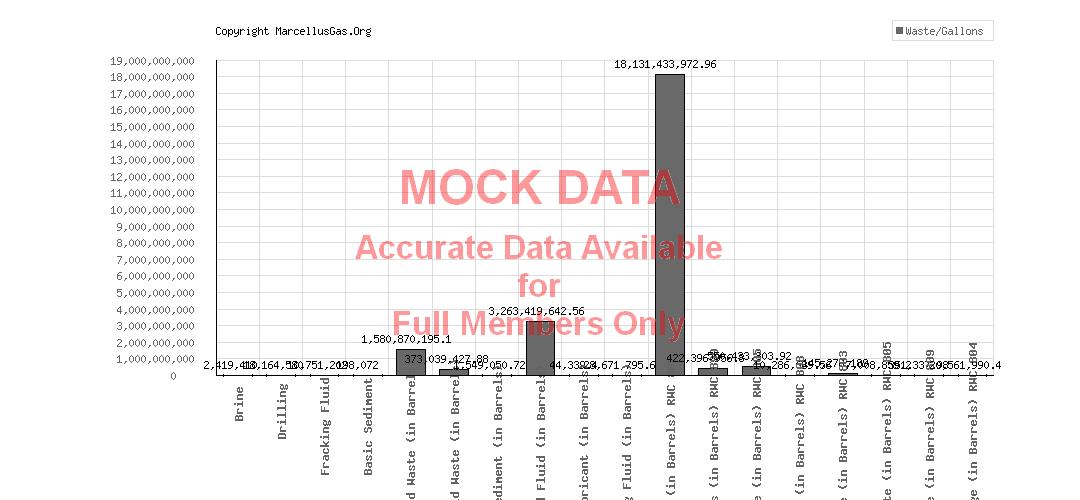
Liquid Waste, by Type, for Susquehanna County, Pennsylvania
|
gallons: the total amount of liquid unconventional well waste produced in Susquehanna County up to Apr 31st, 2026 [DEP data date: 06/18/2026]. This is equivilent to aproximately 18 wheeler tanker truckloads.
Show/Hide Statistical Criteria
Graph: Liquid Waste in Gallons, by Type: Susquehanna County, Pennsylvania
|
|
Types of Liquid Waste
|
Based on DEP data thru Apr. 30th, 2015
|
|
|
|